How to Run Streamlit Apps on Google Colab
-
 Miyoko Shimura
 - 14 Oct, 2024

These days, there are some really approachable ways to create data visualizations for the web without having to become a full-stack developer first.
I will demonstrate how to make useful apps using Streamlit while keeping the web development parts as simple as possible.
What Is Streamlit?

Streamlit is an open-source Python library designed for data scientists and AI/ML engineers to create interactive web applications with minimal effort.
Streamlit lets you focus on your data and insights, making it easy to build and share apps directly from your Python environment.
By the end of this tutorial, you’ll create a visually appealing web app that offers insights into the Iris dataset - all without needing to write a single line of HTML, CSS, or JavaScript.
What You’ll Build
We’re going to create an app that displays three different visualizations of the Iris dataset:
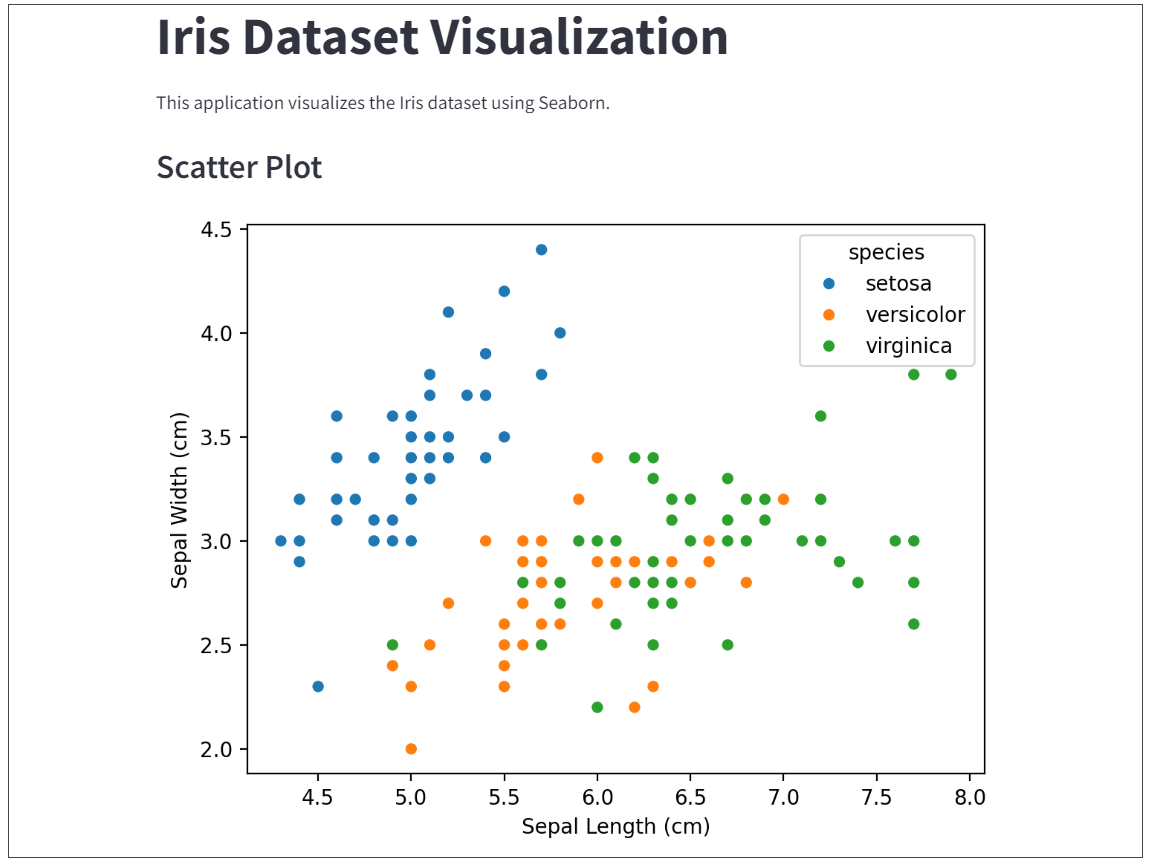
- A scatter plot
- A histogram
- A box plot
Step 1: Setting Up Google Colab
- Go to Google Colab.
- Click on “New Notebook” to create a new Colab notebook.
- Give your notebook a name, like “Iris Visualization App”.
Step 2: Installing Required Libraries
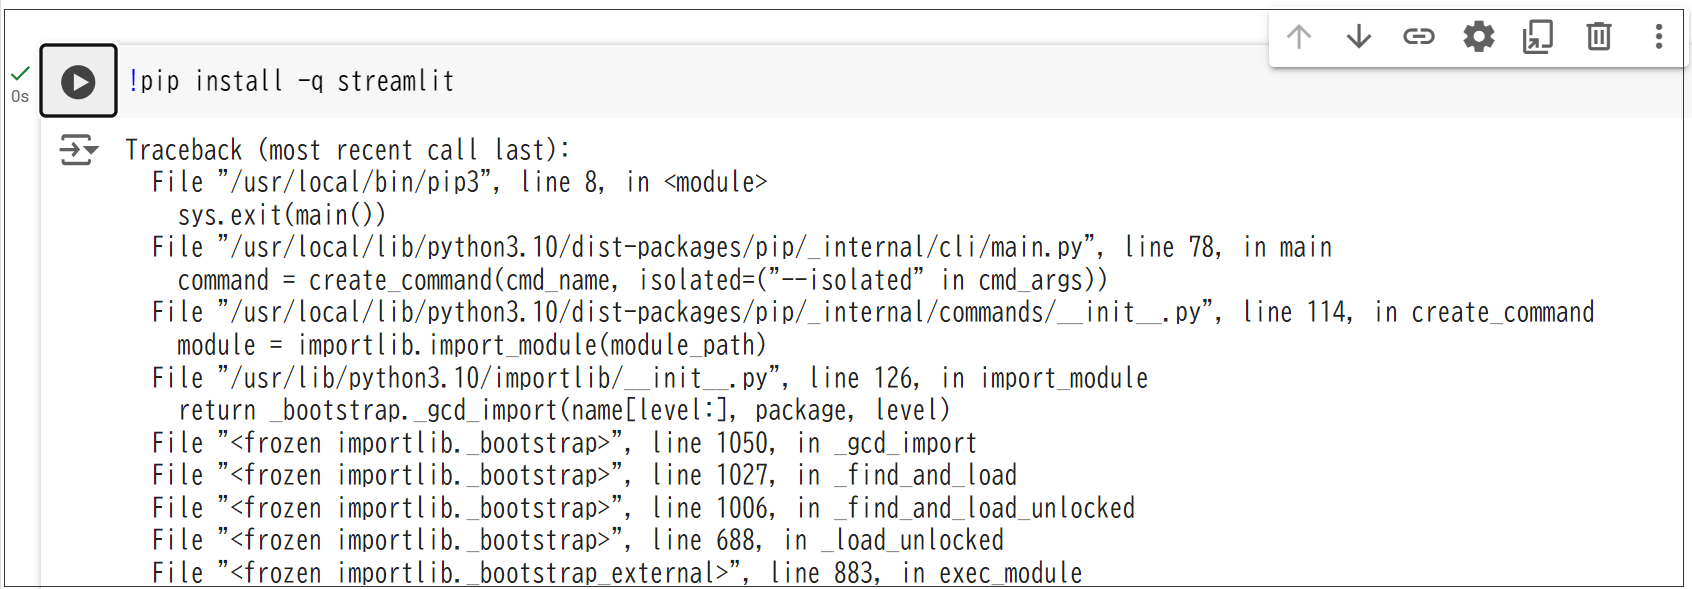
In the first code cell of your Colab notebook, install the necessary libraries. Paste and run the following code:
!pip install -q streamlit
-
The
!at the beginning tells Colab to run this as a shell command rather than Python code. -
pip installis the command used to install Python packages. -
The
-qflag stands for “quiet,” which reduces the output of the installation process.
Step 3: Creating Data Viz App with Python
Now, it’s time to create your data visualization app. In a new code cell, paste the following code:
%%writefile app.py
import streamlit as st
import pandas as pd
import seaborn as sns
import matplotlib.pyplot as plt

# Load the Iris dataset
iris = sns.load_dataset("iris")

# Set page title and description
st.set_page_config(page_title="Iris Dataset Visualization", page_icon=":bar_chart:", layout="wide")
st.title("Iris Dataset Visualization")
st.write("This application visualizes the Iris dataset using Seaborn.")

# Scatter plot
st.subheader("Scatter Plot")
fig, ax = plt.subplots()
sns.scatterplot(data=iris, x="sepal_length", y="sepal_width", hue="species", ax=ax)
ax.set_xlabel("Sepal Length (cm)")
ax.set_ylabel("Sepal Width (cm)")
st.pyplot(fig)

# Histogram
st.subheader("Histogram - Sepal Length")
fig, ax = plt.subplots()
sns.histplot(data=iris, x="sepal_length", bins=20, ax=ax)
ax.set_xlabel("Sepal Length (cm)")
ax.set_ylabel("Frequency")
st.pyplot(fig)

# Box plot
st.subheader("Box Plot")
fig, ax = plt.subplots()
sns.boxplot(data=iris, x="species", y="petal_length", ax=ax)
ax.set_xlabel("Species")
ax.set_ylabel("Petal Length (cm)")
st.pyplot(fig)

# Display dataset
st.subheader("Dataset")
st.write(iris)

# Acknowledgements
st.subheader("Acknowledgements")
st.write("Built with [Streamlit](https://streamlit.io). Iris dataset from [Fisher's 1936 paper](https://archive.ics.uci.edu/ml/datasets/iris).")
This code creates a file named app.py in your Colab environment.
- Import the necessary libraries: Streamlit, Pandas, Seaborn, and Matplotlib.
- Load the Iris dataset using Seaborn’s built-in dataset loader.
- Set up the page configuration and title using Streamlit’s functions.
- Create three visualizations: a scatter plot, a histogram, and a box plot, using Seaborn and Matplotlib.
- Display each visualization using Streamlit’s
st.pyplot()function. - At the end, we show the raw dataset.
Step 4: Run Your App
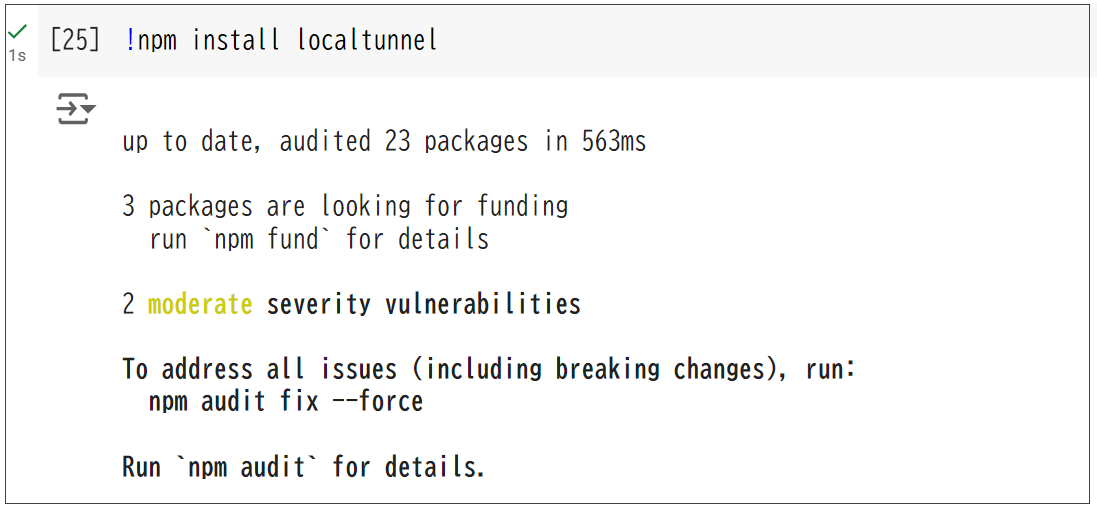
In a new code cell, run the code to install Localtunnel and start your app:
!npm install localtunnel

!streamlit run app.py &>/content/logs.txt & npx localtunnel --port 8501 & curl ipv4.icanhazip.com
!streamlit run app.py: This runs your Streamlit app.>/content/logs.txt: This redirects both standard output and error to a log file.npx localtunnel --port 8501: This uses localtunnel to create a public URL for your app, which is running on port 8501.curl ipv4.icanhazip.com: This fetches and displays your Colab instance’s public IP address.
Look for the line starting with “your url is:” in the output. This is your app’s public URL. Simply click on the URL that appears in the output.

Copy the number from the cell and paste it into the “Tunnel Password” field. Then, click submit. This will open your Streamlit app in a new tab.

Finally, you’ve created and deployed your first data visualization web app.

The app can be expaned by adding more visualizations, implementing user inputs to customize the plots, or even applying machine learning models to the data.
Important Notes
- The public URL is temporary and will only work while your Google Colab notebook is running. If you close the notebook or it times out, you’ll need to run the command again to get a new URL.
- For long-term or production hosting, try using platforms specifically designed for hosting Streamlit apps, such as Streamlit Community Cloud or Heroku.
Next Steps
Here are some ideas to take your skills further.
- Use GitHub to share your projects and host your apps online.
- Try visualizing different datasets (you can find many on Kaggle or data.gov.
- Experiment with different types of charts and graphs.
- Add interactive elements like sliders or dropdowns to manipulate the data.
- Interact with financial or geographical APIs and visualize real-world data.
Conclusion
Building and sharing data visualization apps has never been easier, thanks to tools like Streamlit and platforms like Google Colab. This combination provides an accessible entry point into the world of interactive data apps.

